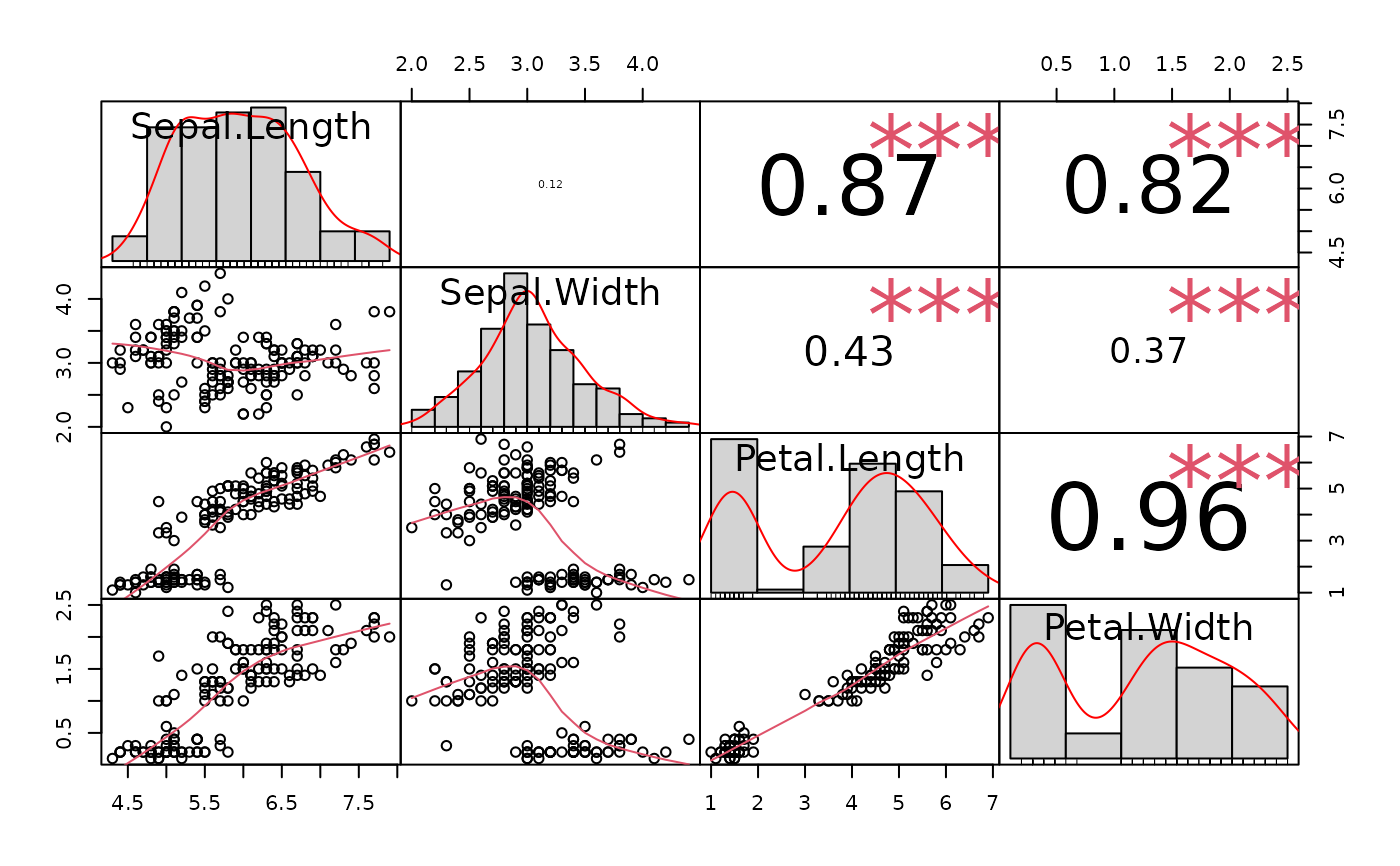
A matrix of scatter plots with rugged histograms, correlations, and significance stars. Much of the functionality borrowed from PerformanceAnalytics::chart.Correlation().
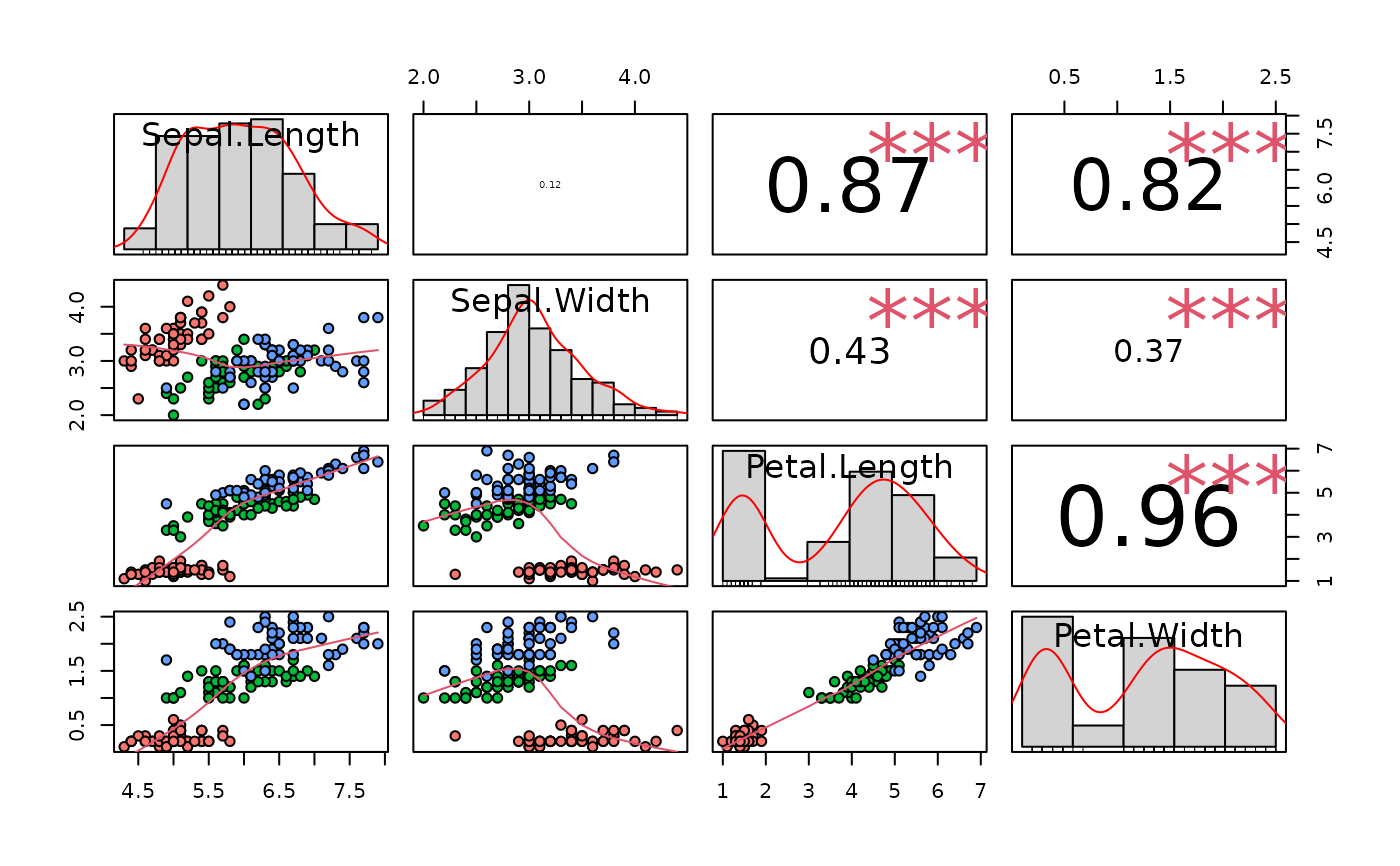
A matrix of scatter plots with rugged histograms, correlations, and significance stars. Much of the functionality borrowed from PerformanceAnalytics::chart.Correlation().