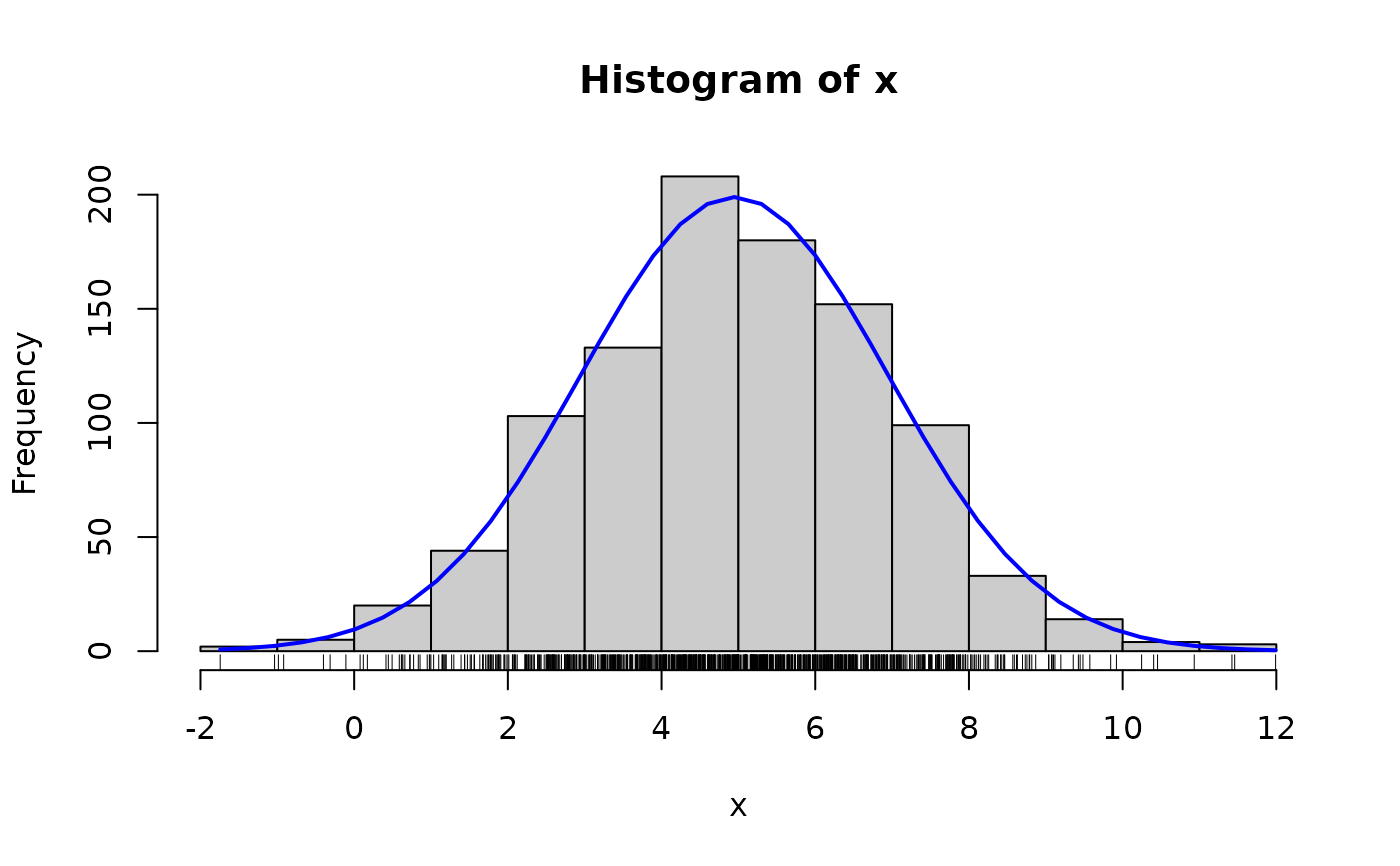
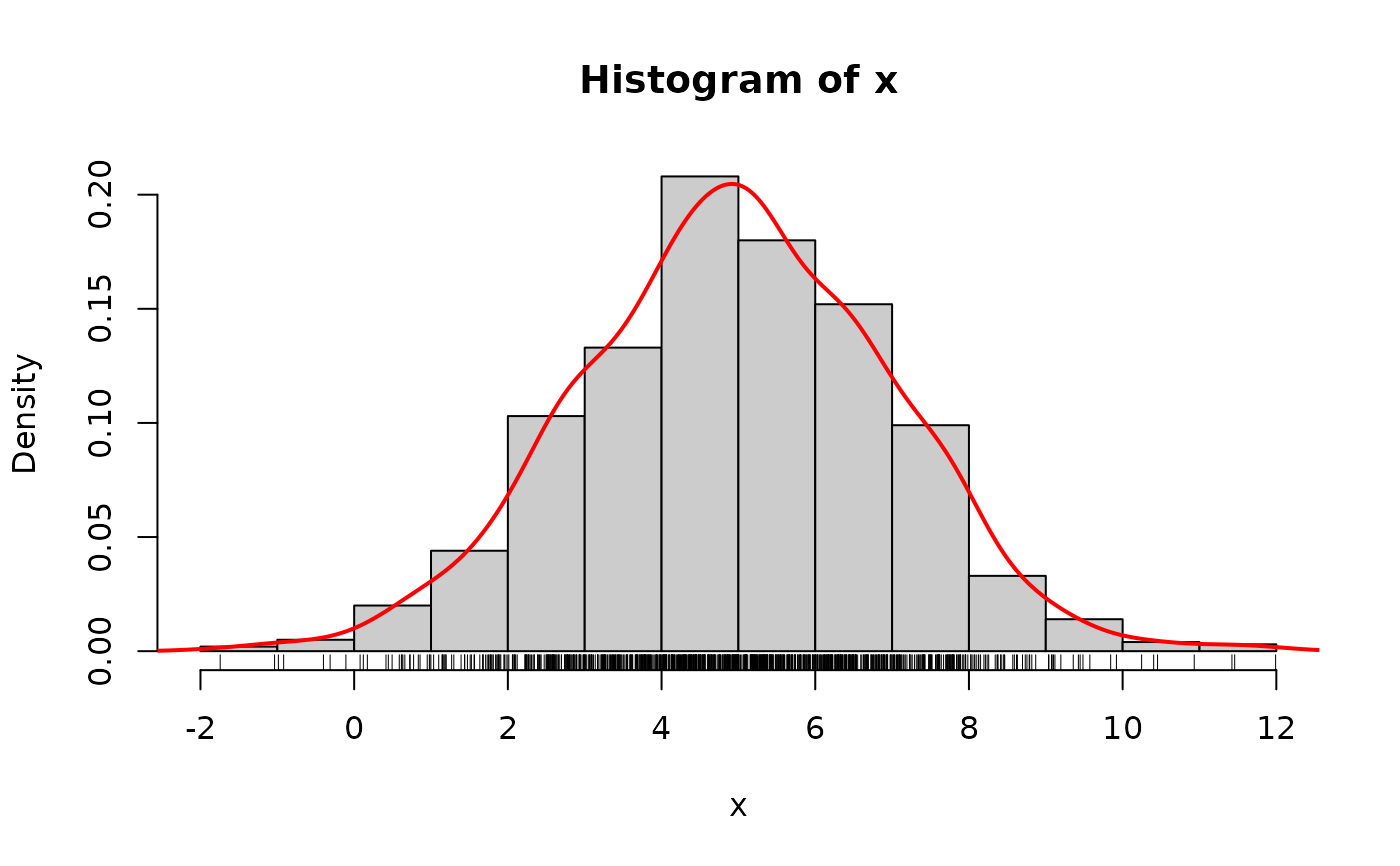
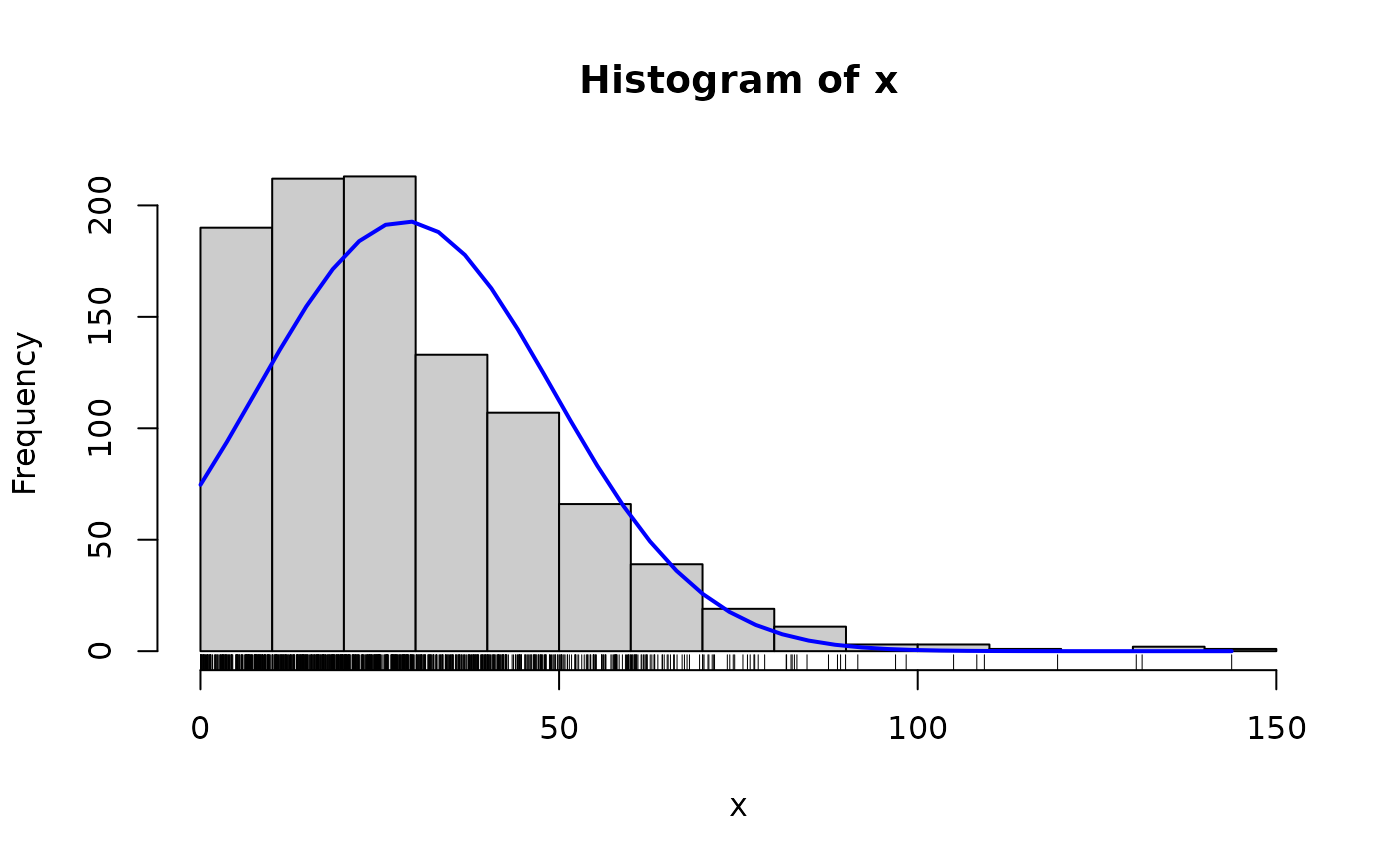
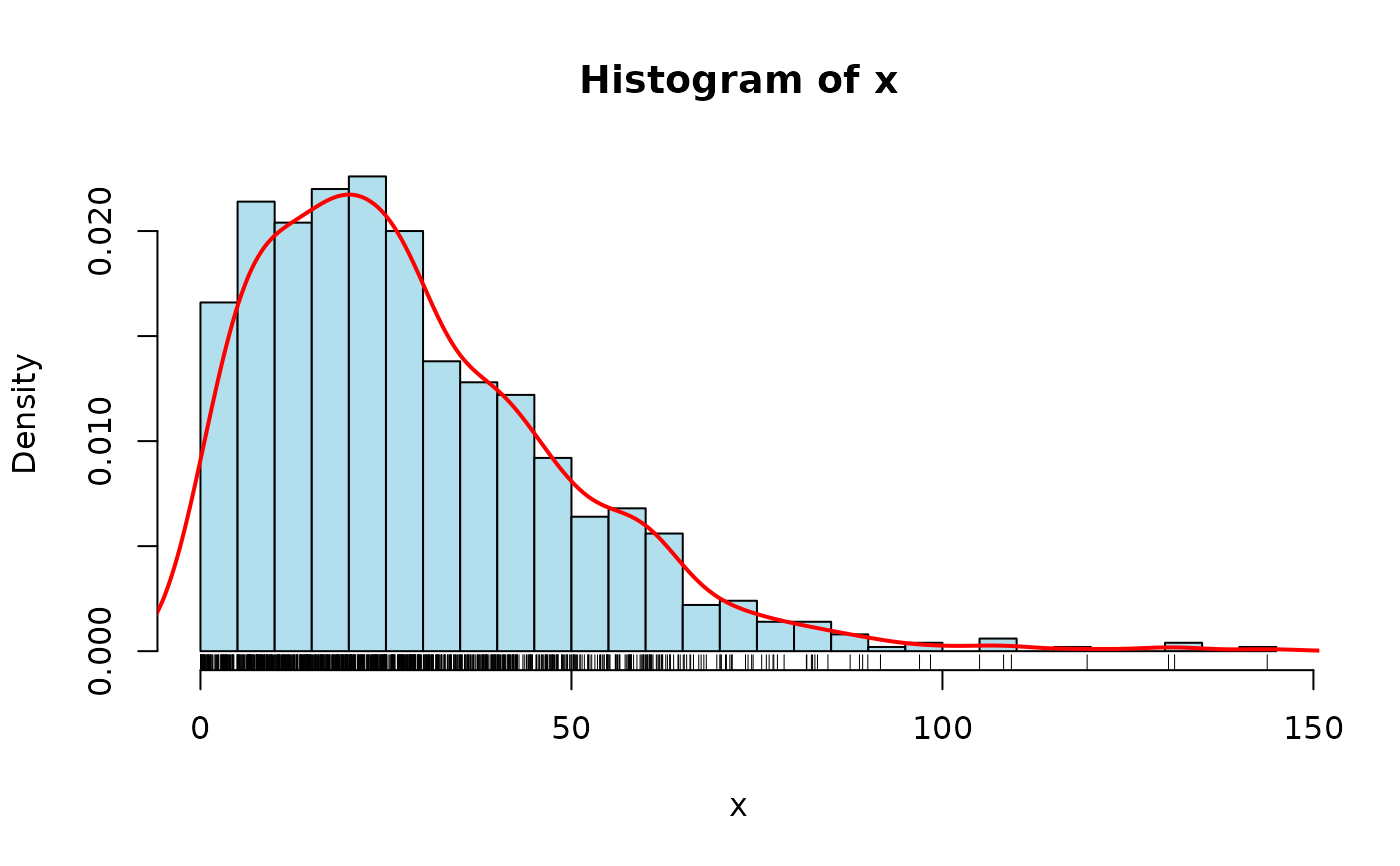
Plot a histogram with either a normal distribution or density curve overlay.
Arguments
- x
A numeric vector.
- overlay
Either "normal" (default) or "density" indicating whether a normal distribution or density curve should be plotted on top of the histogram.
- col
Color of the histogram bars.
- ...
Other arguments to be passed to
hist().